Fresnel Map
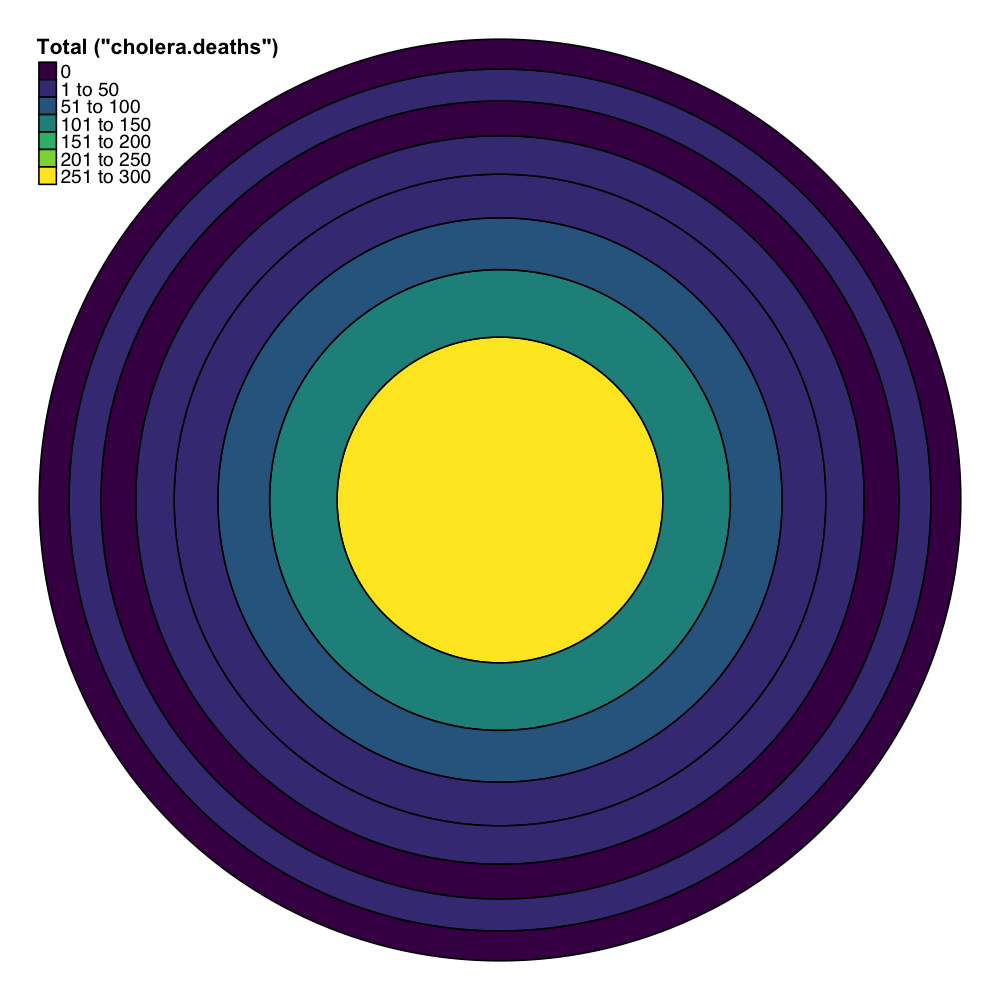
The Fresnel Map is a novel equal-area thematic mapping technique in which data is aggregated and visualised to doughnut-shaped zones that have the same area as the central circle. Created in early 2020 during my doctoral research, more information about this mapping technique can be found in my PhD thesis.
It is inspired by Augustin-Jean Fresnel and Lionel March, who applied similar geometric techniques in architecture and civil engineering. The Codex Atlanticus 221v-b also depicts a diagram with a set of crescent-shaped zones that are equal in area.
An open source R package, fmap, has been created to produce Fresnel Maps and is available on Github.
library(fmap)
library(sf)
library(dplyr)

# Load the sf datasets of cholera deaths and Soho pumps
data(cholera_deaths, soho_pumps)

# Filter the Broad Street Pump from the Soho pumps dataset
bstreet_pump <- soho_pumps %>% filter(soho.pump == "Broad Street")

# Visualise the Fresnel Map
fmap_plot(radius_inner = 125, ncircles = 8, geo_centre = bstreet_pump, geo_points = cholera_deaths, sum = "cholera.deaths")

An example of the Fresnel Map. fmap has been used to aggregate and map cholera deaths around the Broad Street Pump in Soho using digitised data from John Snow's seminal study. Data Source: Robin Wilson's Blog.