Urban Permutations
Permutations can be used to explore and compare building elevations. I developed a software package, elevate, to visualise different urban scenarios. elevate is an R package for visualising building elevations using permutations and bar charts. It creates small multiple bar charts that depict abstracted building elevations and prints the number of potential combinations in the console. It can also be utilised to generate a dataset of the permutations.
library(elevate)

# Storeys per building
storeys <- c(4, 3, 5, 4)

# Visualise elevations
extension_elevations(storeys = storeys, max_permitted_extstorey = 2, output = 'plot')
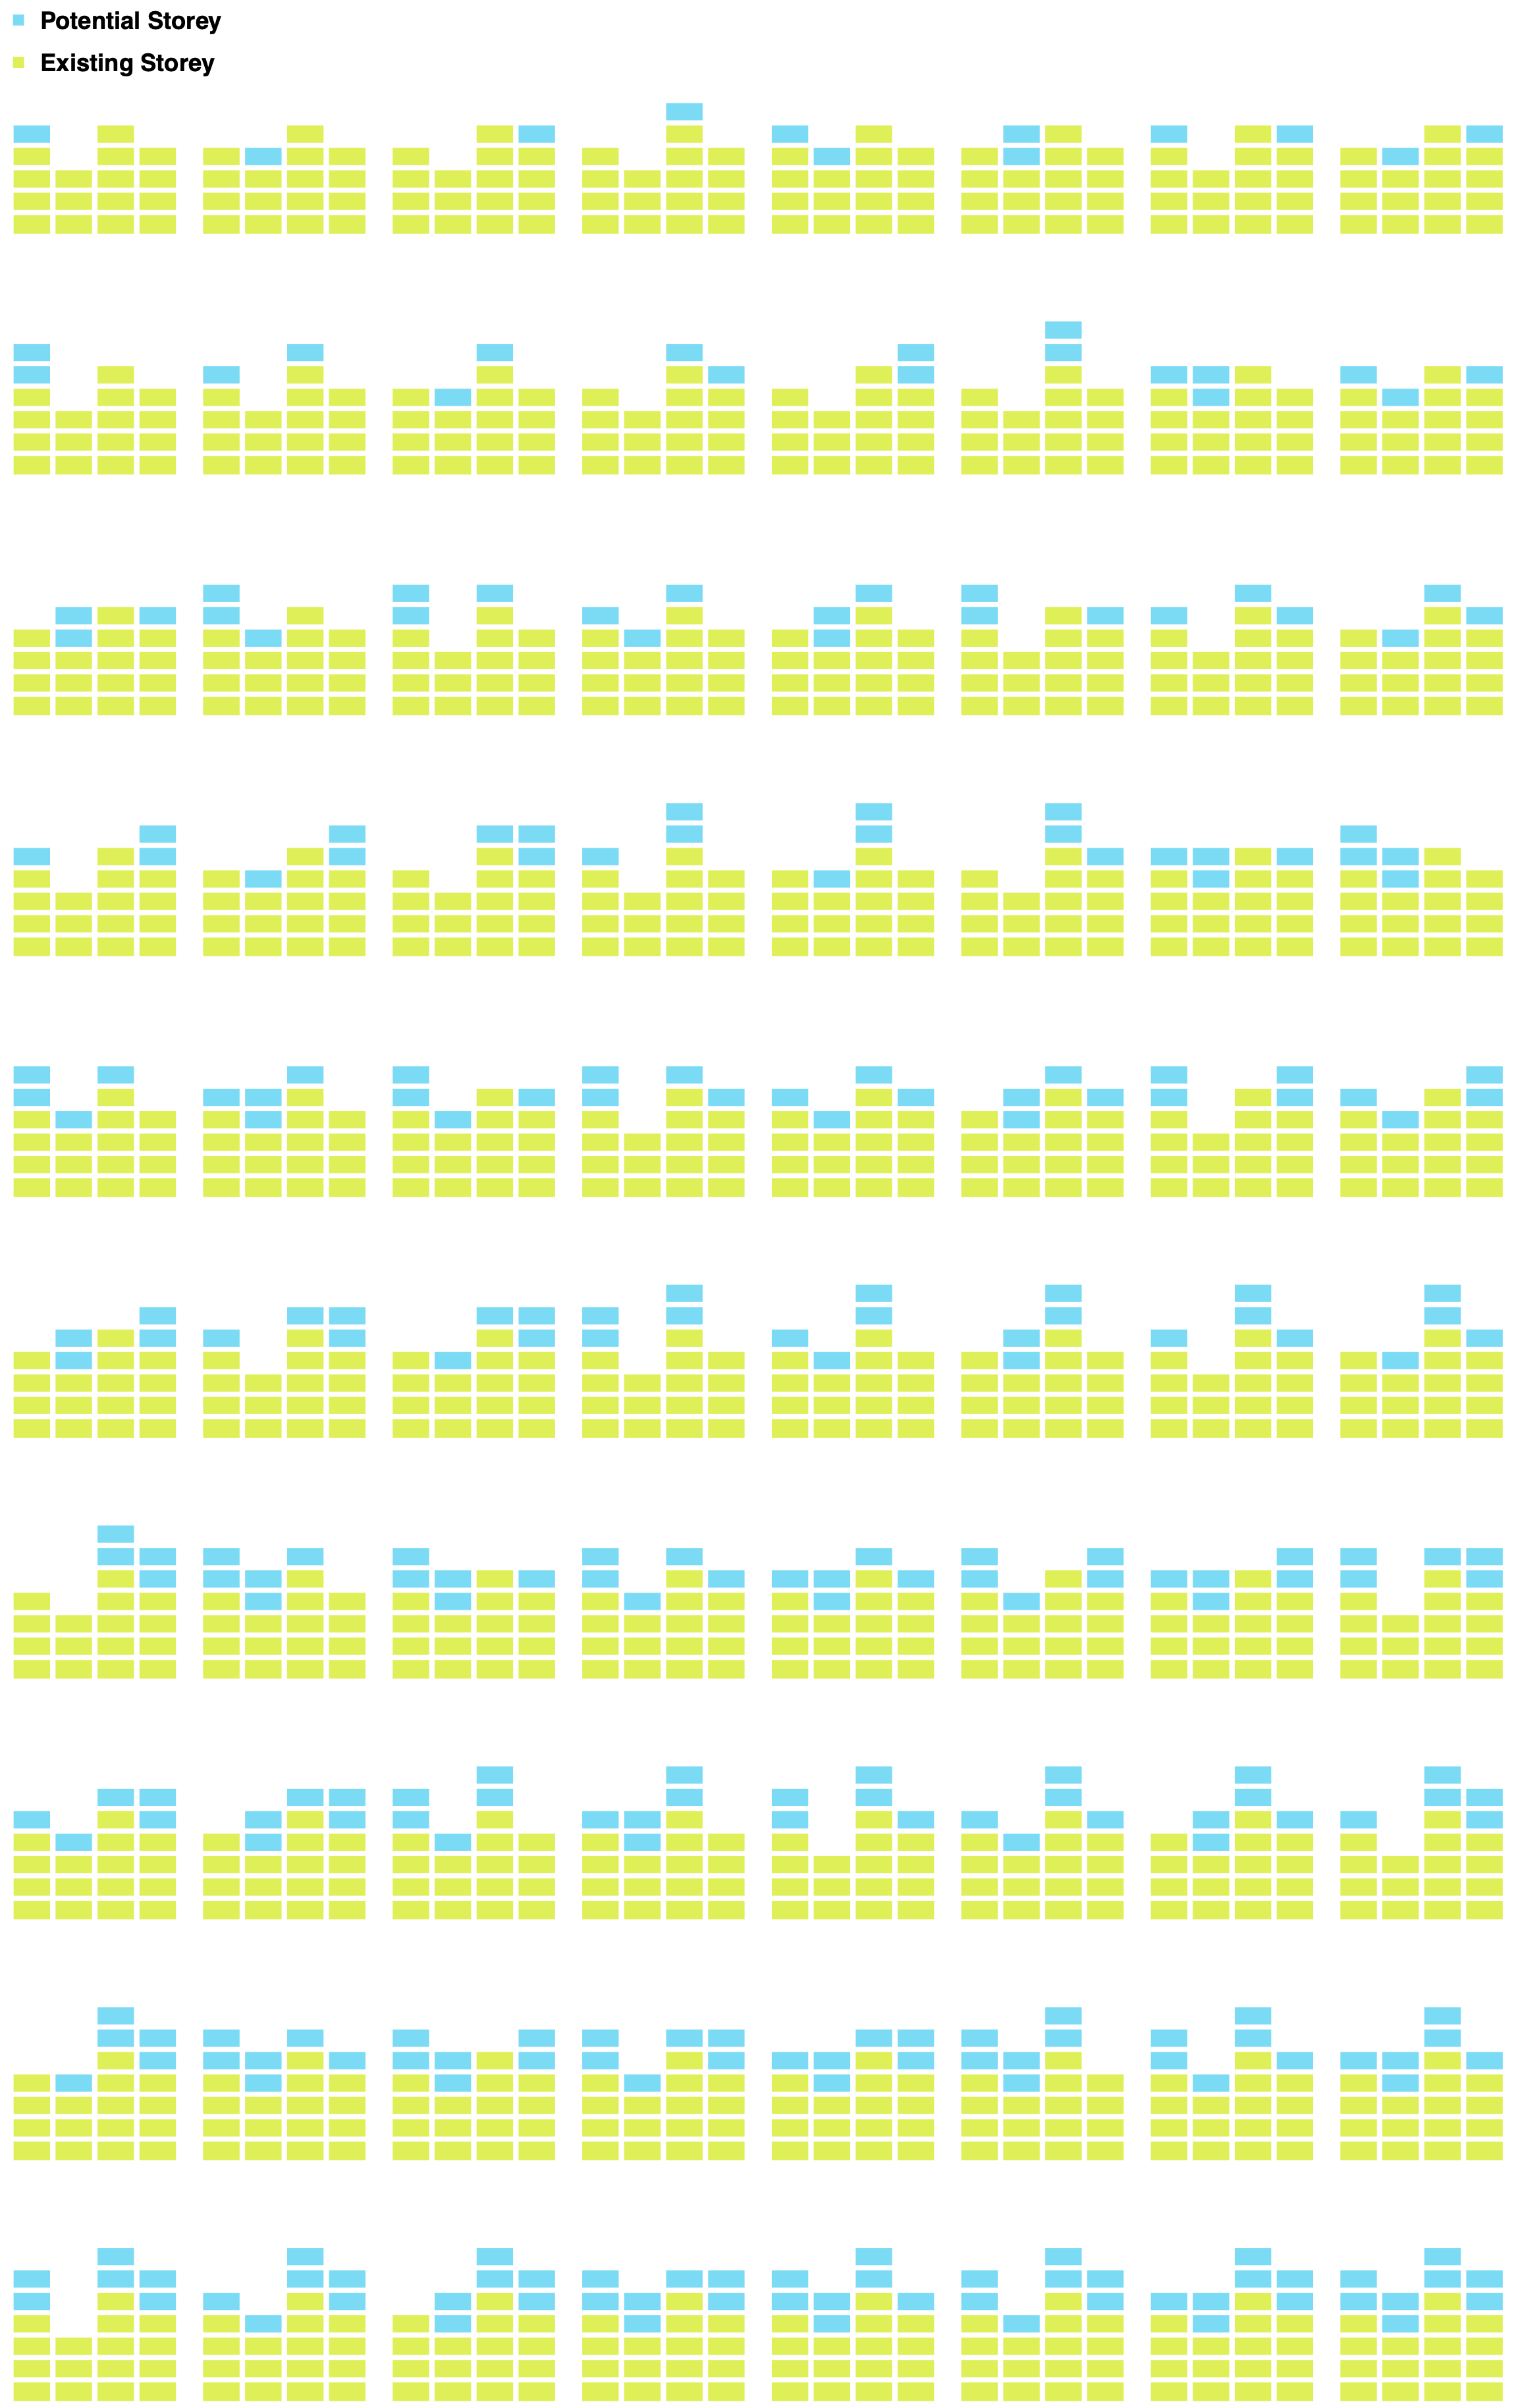
Visualising potential rooftop extension elevations using elevate and information on the maximum number of storeys per rooftop extension.